How To Reduce Unnecessary Trucking Expense By Setting And Managing "Trucking Surplus" Goals
Everyone has always wanted a single metric to represent the efficiency of their trucking operation.
"Are we over trucked?"
Unfortunately - especially for construction operations - it can be a difficult metric to define, let alone calculate. Some of the questions without clear answers include:
- How should we classify the time when trucks are idle due to job or plant down time (planned or unplanned)?
- How should that classification change if the down time lasts for hours?
- How should we consider different production rates throughout the day?
- How should we count under-staggered trucks at the front of the day?
- How should we quantify the impact of late starts?
- How should we quantify the impact of late sign outs?
- How should we account for driving time that is slower or faster than anticipated?
- How should we account for plant load out or dumping time that is slower or faster than anticipated?
- How should we account for the impact of different rates of production throughout the day?
Even with answers to the above questions, the data required to make the calculations has never been consistently available.
But, with the recent release of the fully automated "trucking surplus" metrics and dashboard this winter, we finally have a normalized approach for comparing trucking surplus between jobs and over time.
The purpose of this newsletter is to more fully explain the trucking surplus metrics and recommend a management approach that will optimize your trucking expense.
What does the "trucking surplus" metric represent?
Trucking surplus is a measure of the % of trucking time that was practically unnecessary given the balance between the rate of supply and rate of demand throughout a job day.
A low % indicates that most truck time was spent doing something that was unavoidable given the supply and demand characteristics of the day. A high % indicates that significant time was wasted that should have been avoidable.
Let's look at some examples:
This first example shows a job production plan with an extremely low surplus (5%).

Some details of note:
- The planned surplus was also relatively low (8%). In order to consistently achieve low actual surplus outcomes, this is extremely important.
- While the plan calculated that one fewer trucks were needed than dispatched, the actual possible cycle time was slightly slower than was planned which made that extra truck required to hit the planned production rate.
- There was a detected production incident at the job site at 12:30AM that created a bit of surplus between 12AM and 2AM (though given that it's a night job, there was probably very little that could be done to reclaim that time).
- Aside from the effect of the detected production incident, things couldn't have gone much more smoothly. There was little waiting at the job site or material site, and the drive time was relatively consistent.
To calculate the actual surplus, the platform uses observed values for cycle time, production rate, and load factor and simulates the day to determine how many trucking hours were required to achieve the actual outcome. It uses as much GPS data as is available and triangulates with statistical cycle time measures to determine what's possible.
The keys to this job's efficiency were:
- Accurate planning
- Tight dispatch
- Solid operational execution
If there's a process breakdown at any of the above steps, the job will either be over trucked or won't hit its production targets. Given that construction management is understandably risk averse regarding production goals, the natural outcome is to over truck as insurance. But, as this job shows, when all three processes are working in harmony, production goals can be achieved with little waste.
This second example shows a job production plan with an extremely high surplus (43%).
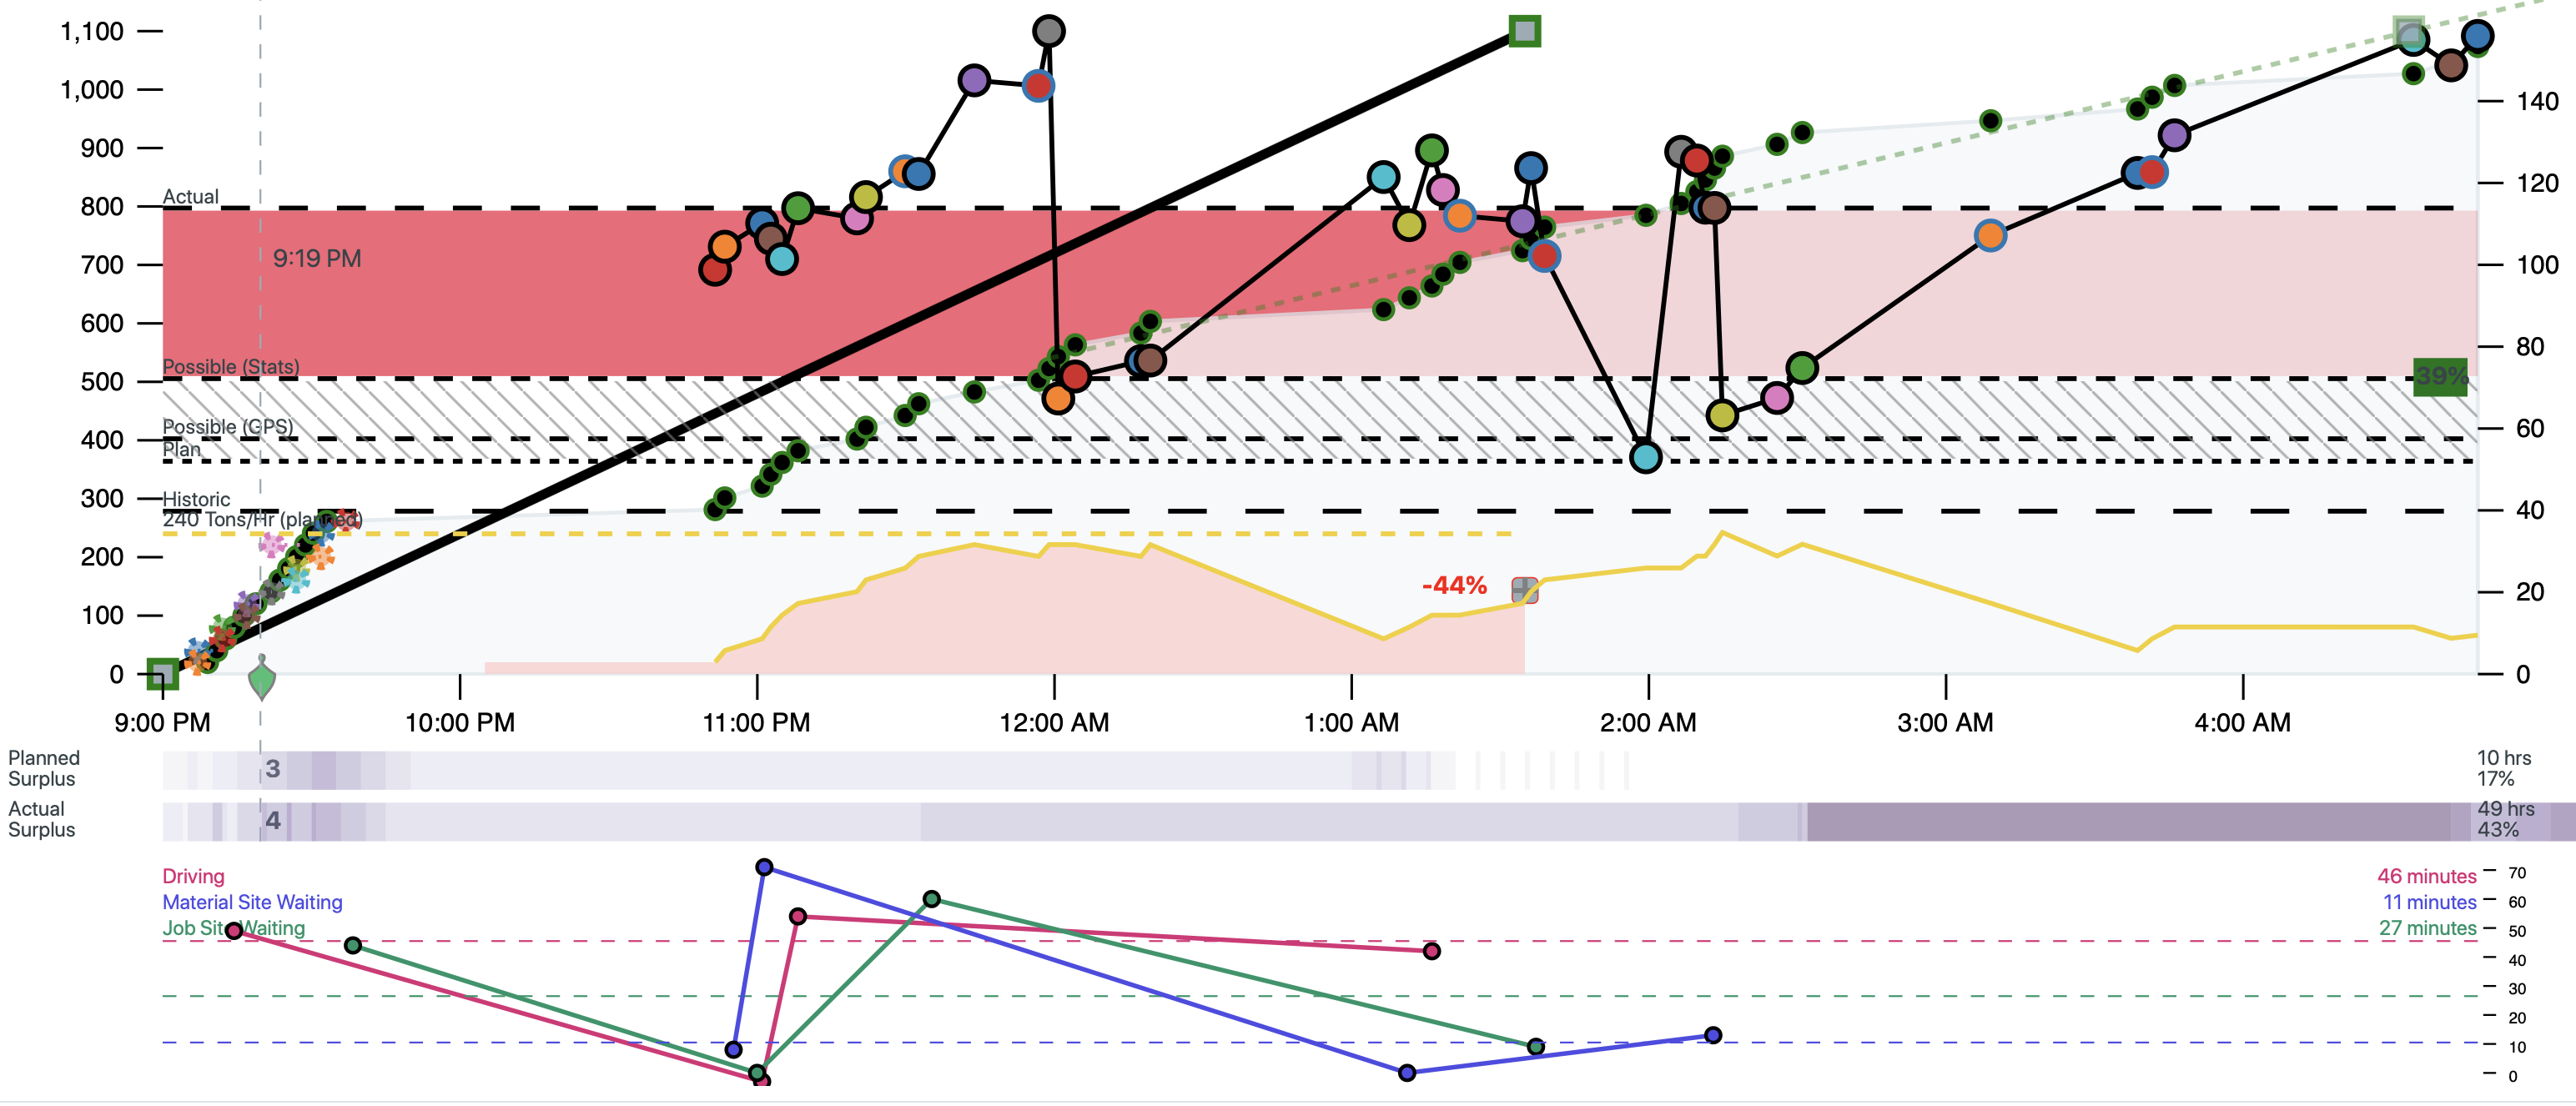
There were breakdowns in all three key areas listed above.
- The production rate was incorrectly estimated
- The quantity of trucks dispatched was too high even if the production rate was achievable
- The trucks were not staggered adequately which was the fault of the dispatch itself, not the plant (given that they were just following instructions)
- The management of cutting trucks at the end of the shift was too loose
If we look at one specific truck, it's not difficult to see the surplus (most of that orange time).

Since this surplus metric is calculated automatically using all available information and considers all the fiddly questions outlined above, we can use it to track how well we're doing at any level with confidence.
A "Trucking Surplus Dashboard" is available at the customer level that does just that. You can set a target trucking surplus amount and see the opportunity from a reference period, and how well you're doing against that goal during the comparison period. These metrics are calculated at the material type, planner, project manager, month, and job number levels. In addition, you can see "Hall of Fame" days where the target surplus % was achieved.

Now is the perfect time to put in place a formal trucking surplus management program for 2021.
We recommend the following specific steps:
- Ensure that all team members are educated on the planning, dispatch, monitoring, and analytics tools mentioned above.
- Review past performance to become familiar with the current state of your trucking surplus.
- Set a specific trucking surplus goal for 2021. In general, we believe that 15% is an achievable goal for most organizations.
- Build your planning and dispatch processes for zero surplus.
- Monitor plans actively to coordinate adjustments that will reduce surplus.
- Review the actual surplus of plans daily to identify opportunities to improve these processes.
- Celebrate the wins! It's beautiful to see it all come together as in the first example above.
One of the great things about managing trucking surplus is that it has the side benefit of causing many other related processes to improve. You can't do well in this area without doing well in general, especially if you're also pushing to maximize daily production (more on that in another newsletter!).
If you have any questions about this topic, any related feature ideas, or need help refining your trucking surplus management program, please let us know.
Regards,
Sean Devine
Founder & CEO, XBE